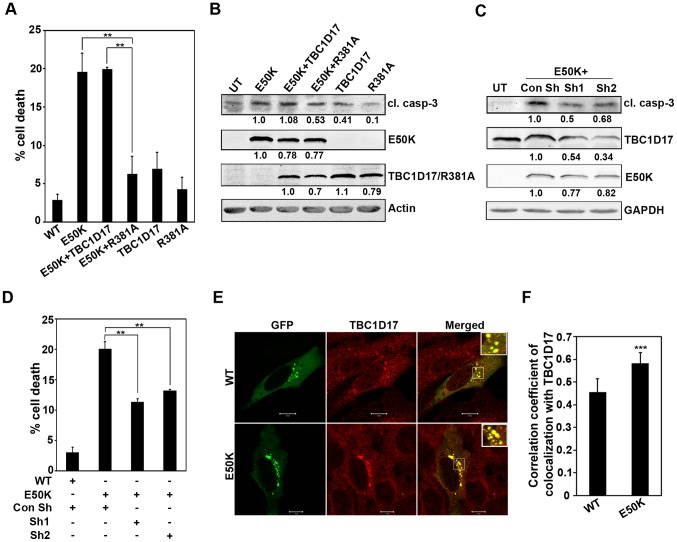
Figure 1. E50K-OPTN-induced cell death is dependent on TBC1D17.
(A) Cells plated on coverslips were transfected with HA-E50K alone or cotransfected with HA-E50K and GFP-TBC1D17 or GFP-R381A. After 32 hours of overexpression, cells were fixed and stained with HA antibody. Bar diagram depicts percentage of cells showing E50K-induced death in the presence of TBC1D17 and R381A after subtracting background cell death in non-expressing cells. When coexpressing E50K and TBC1D17 or R381A, cells expressing both E50K and TBC1D17/R381A were counted as expressing cells. Data represent mean ± SD of 4 experiments. **p<0.01 (Student’s t-test) (B) Cells plated in 35-mm dishes were transfected with GFP-E50K alone or cotransfected with GFP-E50K and HA-TBC1D17 or R381A. Protein lysates were made at the end of 32 hours of overexpression and subjected to western blotting with cleaved caspase-3 (cl. casp-3), GFP and HA antibodies. Actin was used as a loading control. UT, untransfected. The numbers below the blots indicate relative level of expression normalized with the loading control. (C) Cells plated in 35-mm dishes were cotransfected with 1 µg of GFP-E50K and 2 µg of control shRNA (Con Sh) or shRNAs against mouse TBC1D17 (sh1, sh2). Cell lysates were made at the end of 32 hours of overexpression and subjected to western blotting with cleaved caspase-3, GFP and TBC1D17 antibodies. GAPDH was used as a loading control. (D) Cells plated on coverslips were transfected with 150ng of GFP-E50K along with 300ng of control shRNA plasmid or TBC1D17 shRNA plasmids (sh1, sh2). After 32 hours of transfection, cells were fixed and cell death was determined in E50K expressing cells. Bar diagram depicts percentage of cells showing E50K-induced death in the presence of control shRNA and shRNA against TBC1D17 after subtracting background cell death in non-expressing cells. Data represent mean ± SD of 3 experiments. **p<0.01 (Student’s t-test) (E) Cells were transfected with 100ng of GFP-WT OPTN or GFP-E50K. After 24 hours of transfection, cells were fixed, stained with TBC1D17 antibody and analysed by confocal microscopy. Colocalization is shown by merging of red (TBC1D17) with green (WT/E50K) giving yellow color in the merged images. Scale bar: 10 µm. (F) Bar diagram showing correlation coefficient of colocalization of endogenous TBC1D17 (red) with WT-OPTN or E50K (green). n = 15 cells. ***p<0.001.

