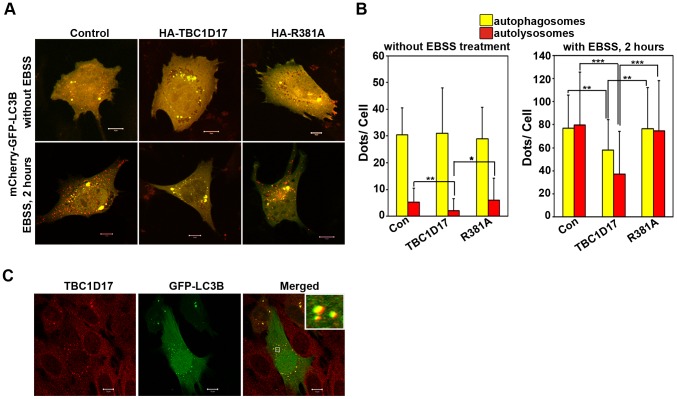
Figure 6. Inhibition of autophagy flux by TBC1D17.
The cells plated on coverslips were cotransfected with 150ng of mCherry-GFP-LC3B along with 150ng of control plasmid or HA-TBC1D17 or HA- R381A plasmids. After 22 hours of transfection, one set of coverslips were kept untreated whereas the other set were treated with EBSS for 2 hours. (A) Images show representative fields with autophagosomes (yellow) and autolysosomes (red) Scale bar: 10 µm. (B) Bar diagram showing number of autophagosomes (yellow) and autolysosomes (red) per cell (mean±SD) n = 40 cells from 2 independent experiments. *p<0.05, **p<0.01, ***p<0.001 (C) The cells plated on coverslips were transfected with 100ng of GFP-LC3B and 22 hours after transfection stained with TBC1D17 antibody before confocal microscopy. Colocalization of TBC1D17 with LC3B in the foci is shown by merging of green (GFP-LC3B) with red (TBC1D17) giving yellow colour in the merged panels. Scale bar: 10 µm.

