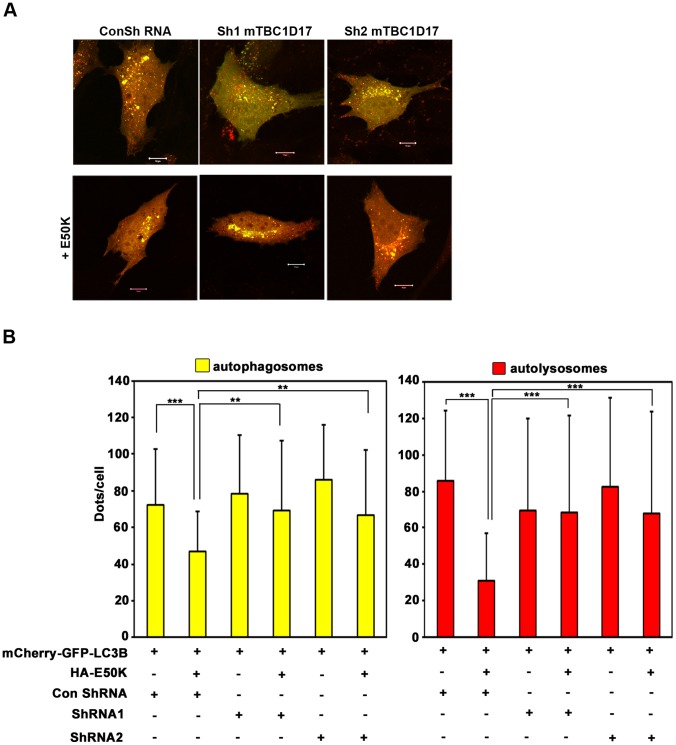
Figure 7. E50K-OPTN-induced inhibition of autophagic flux is rescued by TBC1D17 knockdown.
The cells plated on coverslips were cotransfected with mCherry-GFP-LC3B and indicated plasmids. After 28 hours of transfection, cells were treated with EBSS for 2 hours. (A) Images showing representative fields with autophagosomes (yellow) and autolysosomes (red). Scale bar: 10 µm. Bar diagram showing number of autophagosomes (yellow) (B) and autolysosomes (red) (C) per cell in EBSS treated cells (mean±SD). n = 40 cells from 2 independent experiments. **p<0.01, ***p<0.001.

