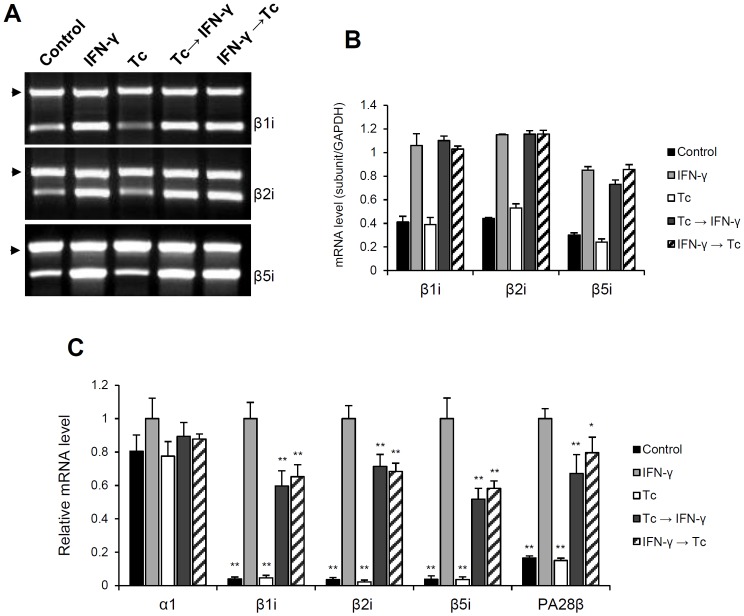
Figure 2. Analysis of immunoproteasome mRNA levels during T. cruzi infection.
Semi-quantitative RT-PCR analysis of β1i, β2i and β5i expression were done using total RNA from HeLa cells treated with IFN-γ and/or infected with T. cruzi. (A) The PCR products were analyzed by electrophoresis in 1.2% agarose gels stained with ethidium bromide. The reactions were carried as duplex-PCR, using GAPDH as internal control (arrows). (B) mRNA levels were determined by densitometry and plotted using the expression of GAPDH as normalizer. Each value represents the mean ± standard deviation of three individual experiments. The abundance of α1, β1i, β2i, β5i and PA28β mRNAs were also determined by real time RT-qPCR. The relative expression of the transcripts was calculated by normalization with GAPDH and HPRT1 housekeeping genes using the 2−ΔΔCt method. (C) The mRNA levels were plotted relatively to “IFN-γ” experimental condition (HeLa treated 24 h with IFN-γ). Each value represents the mean ± standard deviation of three independent experiments.

