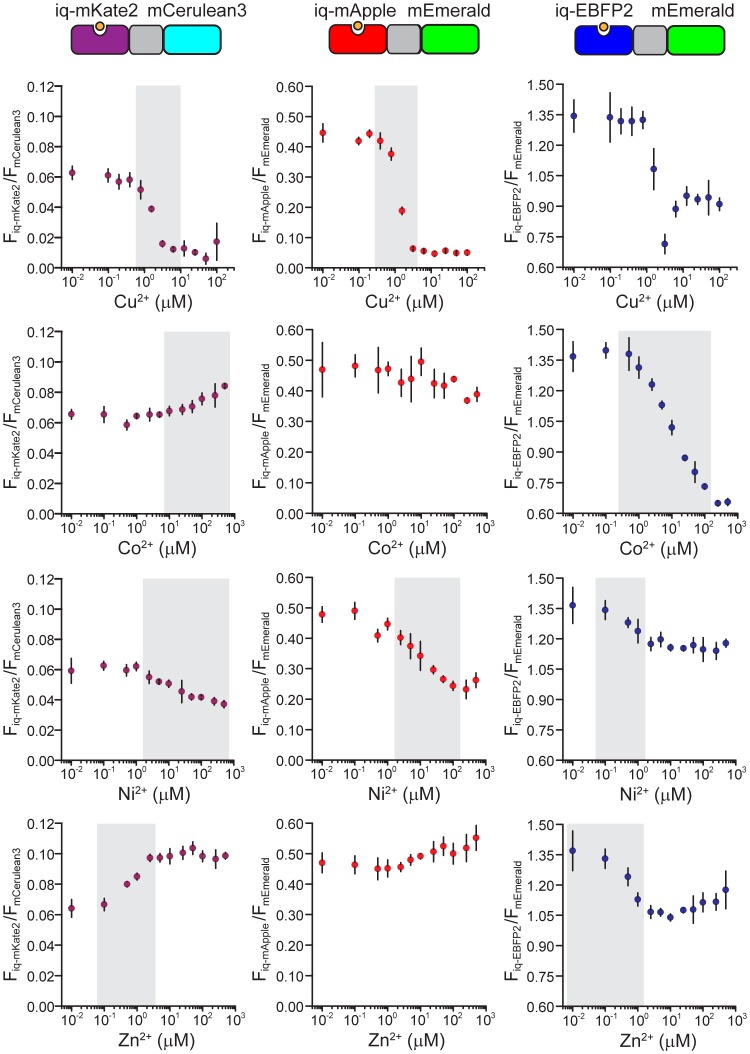
Figure 3. Quenching curves for three ratiometric chimeras, iq-mKate2/mCerulean3, iq-mApple/mEmerald, and iq-EBFP2/mEmerald.
Relative fluorescent intensities are calculated by dividing the intensity of iq-FP by the intensity of FP (Fiq-FP/FFP) at each metal concentration. For every chimera, the response to four metal ions, Cu2+, Co2+, Ni2+ and Zn2+ are plotted. Gray bars indicate the optimal dynamic range for each chimera and metal ion pair. Although the fluorescence ratios of some chimeras are small, the actual measurement of each component of these chimeras is still well above the background and can be measured with high sensitivity, so the small ratio numbers are not a reflection of the overall sensitivities of these chimeras. All data are average ± S.D.

