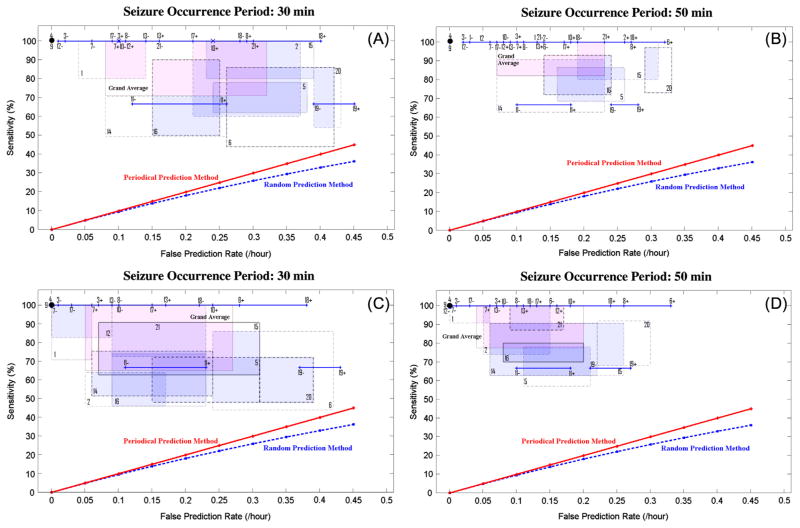
Fig. 3.
Sensitivity versus false prediction rate for each patient (as indicated by patient number in Table 1) and for the grand average across patients (labeled in pink as grand average) using seizure occurrence periods of 30 min (A and C), and 50 min (B and D) and a seizure prediction horizon of 10 s. Results for the maximum sensitivity and maximum specificity strategies are shown in (A–B) and (C–D), respectively. For each patient, a box shows the range of variation of sensitivity versus false prediction rate obtained using different randomly selected reference windows. It is of note that a line (e.g. for patient 11) or a dot (e.g. for patient 4) represents the results where no variations in sensitivities or/and in false prediction rates were observed. Plus and minus signs used with the patients’ number denote the upper and lower bounds of the corresponding ranges of variation. The performances of the random and periodical prediction methods as described in the Supplementary Material are shown in all four panels (A–D). (For interpretation of the references to color in this figure legend, the reader is referred to the web version of this article.)

