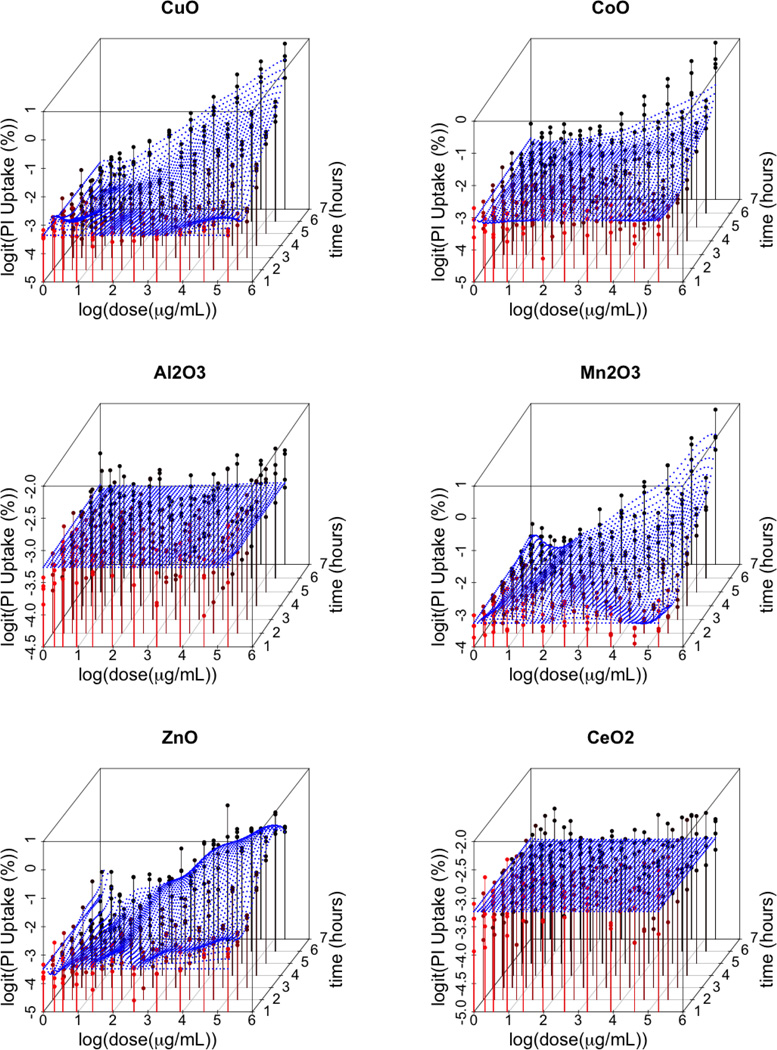
Figure 2. Fitted response surfaces for CuO, CoO, Al2O3, Mn2O3, ZnO, CeO2 ENMs.
Estimated smooth response surfaces of cellular membrane damage, as measured by Propidium Iodine (PI) uptake, as a function of log(dose) and time. The color red represents response values corresponding to lower time points and the color black represents response values corresponding to higher time points.

