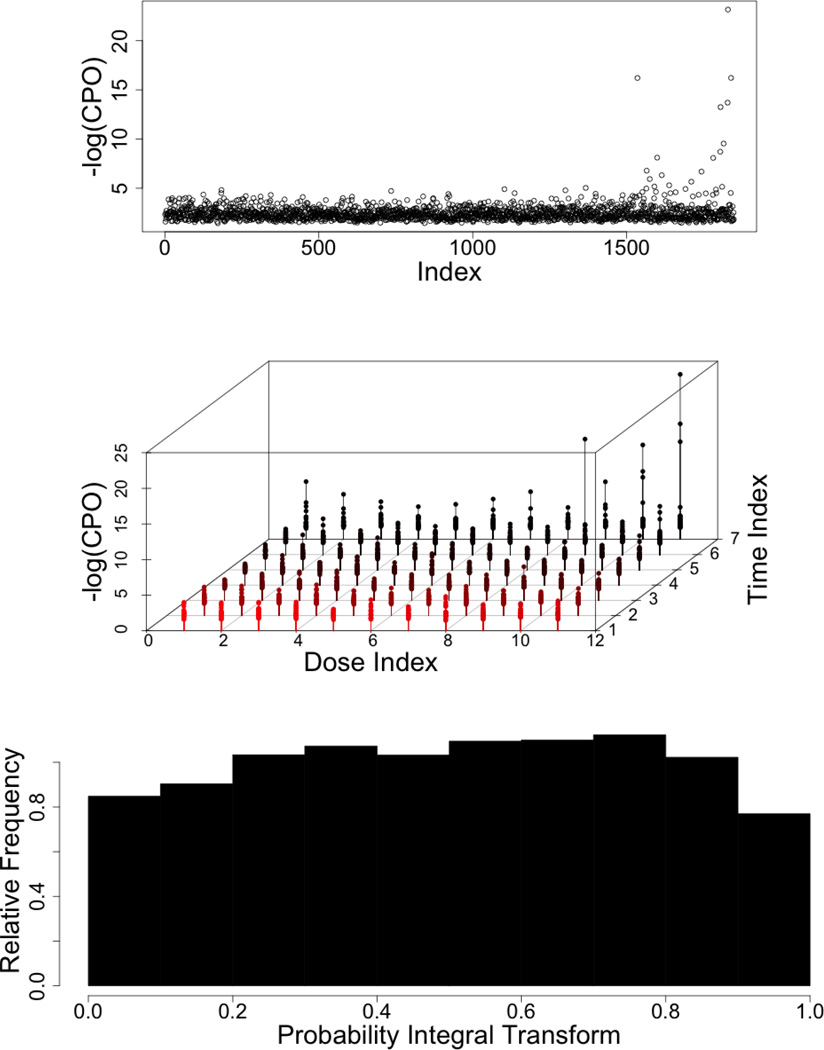
Figure 5. Graphical model diagnostics.
(Top) Estimate of −log(cpoi(d, t)) for detecting observations with poor model fit. (Middle) Plot of −log(cpoi(d, t)) as a function of dose and time, indicating any relationship between outlying observations and the administered dose or duration of exposure. (Bottom) Probability Integral Transform assessing empirical calibration of the posterior predictive distribution.

