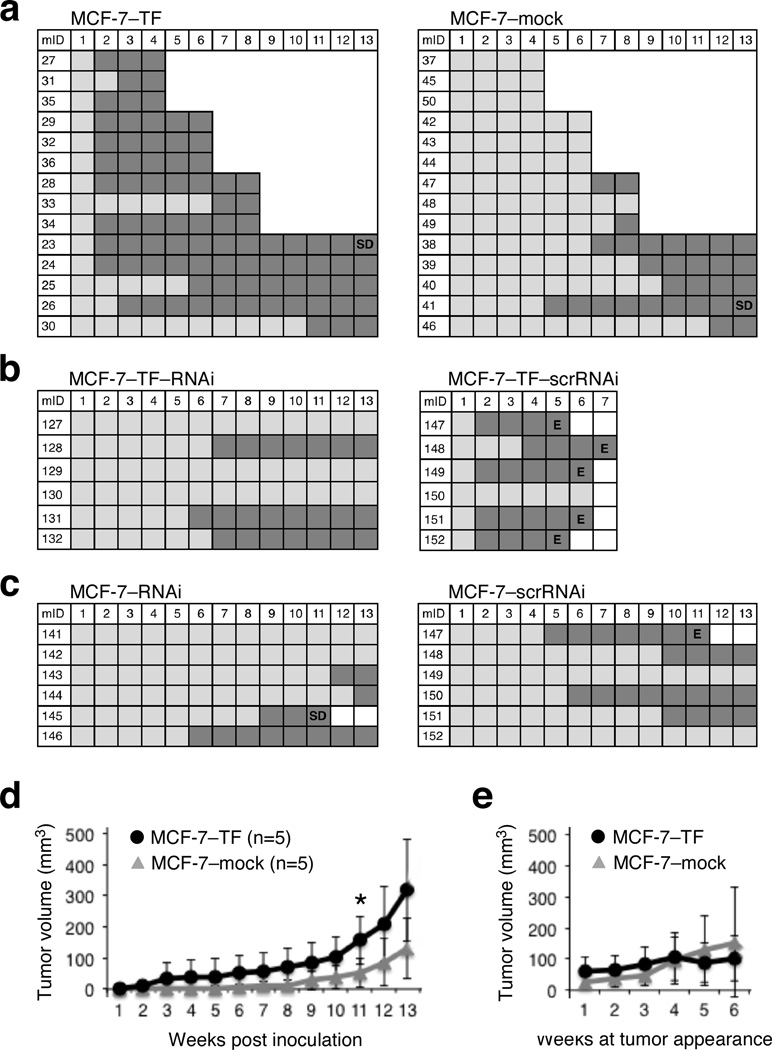
Figure 1.
NKG2D effects on tumor latency, incidence and growth in the orthotopic MCF-7 xenotransplant model. (a–c) Graphic representations of tumor development over time measured in weekly intervals (top numbers) following implantation of the MCF-7 model lines. Left vertical numbers refer to mouse identifications (mID). Dark grey squares indicate presence of measurable tumor mass; light grey squares indicate absence of tumor mass. SD=spontaneous death, E=euthanasia. (a) Implanted MCF-7–TF cells develop tumors earlier and more frequently than MCF-7–mock control cells. The staircase representation reflects termination of each three mice per group at weeks four, six and eight. Remainder mice were maintained for a minimum of 13 and a maximum of 14 weeks (see text). (b) Delayed appearance and reduced frequency of MCF-7–TF–RNAi tumors compared to MCF-7–TF–scrRNAi controls. (c) RNAi-mediated depletion of minimal endogenous NKG2D enhances latency of MCF-7–RNAi compared to MCF-7–scrRNAi tumors. (d) Graphic representations of MCF-7–TF and MCF-7–mock tumor volume averages and standard deviations at the indicated weekly time intervals post tumor cell inoculation. Data were derived from each five mice per group corresponding to those in (a) monitored for 13 or 14 weeks. Asterisk denotes p<0.05. (e) Graphic representation of MCF-7–TF and MCF-7–mock tumor volume averages normalized to times of tumor appearance. Data were derived from the same mice studied in (d). Normalization of tumor volumes to times of tumor appearances affects group sizes at each weekly interval as follows: Weeks 1 to 3, MCF-7–TF (n=5) and MCF-7–mock (n=5); week 4, MCF-7–TF (n=5) and MCF-7–mock (n=4); week 5, MCF-7–TF (n=4) and MCF-7–mock (n=4); week 6, MCF-7–TF (n=4) and MCF-7–mock (n=3).

