
Figure 3.
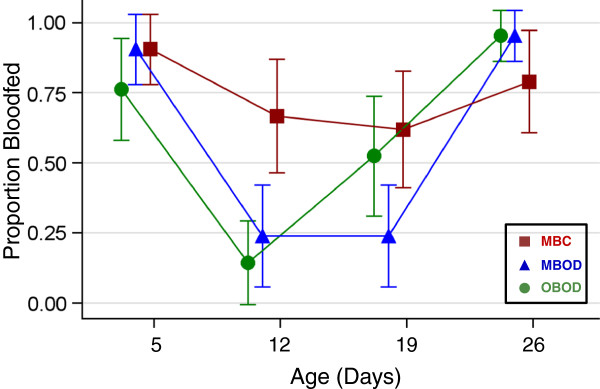
Bloodfeeding rates of the feeding assay performed in the first 4 weeks (see Methods) by treatment group. Mean and standard error of the replicates are represented. Abbreviations and colors of treatment groups as in Figure 1.
Official websites use .gov
A
.gov website belongs to an official
government organization in the United States.
Secure .gov websites use HTTPS
A lock (
) or https:// means you've safely
connected to the .gov website. Share sensitive
information only on official, secure websites.
Bloodfeeding rates of the feeding assay performed in the first 4 weeks (see Methods) by treatment group. Mean and standard error of the replicates are represented. Abbreviations and colors of treatment groups as in Figure 1.