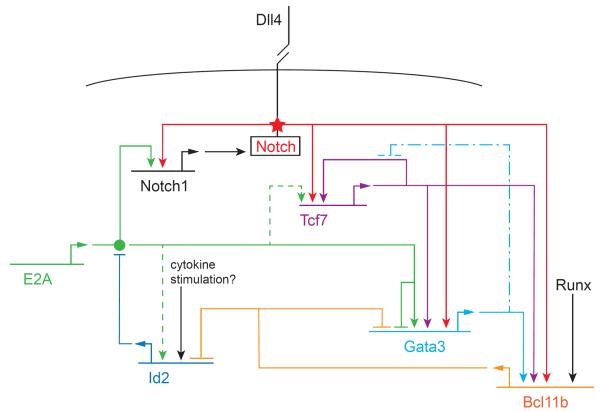
FIGURE 3.
Partial gene regulatory network for early T-cell specification. Horizontal lines: genes coding for regulatory factors. Bent arrows: transcription and translation of gene leading to product (itself a regulatory factor). Genes and their products have the same color code. Arrows: positive regulatory effects of factors on indicated genes. Blocked-end lines: negative regulatory effects of factors on indicated genes. Filled circle: ability of E2A to form a functionally active dimer: this assembly is blocked by Id2. Star: activation of Notch transmembrane protein by binding to its ligand Delta-like 4 (DLL4) on a neighboring cell; the effect is to cleave the Notch intracellular domain and allow it to be transported to the nucleus where it functions as a transcriptional coactivator on the indicated target genes. Note that none of these regulators acts in a strictly all-or-nothing way. Although many genes require Notch input for activation, those shown here do not require its continuation for maintenance of of expression. The repressors indicated here modulate rather than silence the indicated target genes. Solid lines: relationships with strong molecular and functional support within the context of T-lineage specification. Dashed lines: relationships seen in related cells but not directly demonstrated in DN T-cell precursors. Long dash-dot lines: inferred effect of GATA-3 on Tcf7 when GATA-3 is overexpressed. Details and sources are given in the text.

