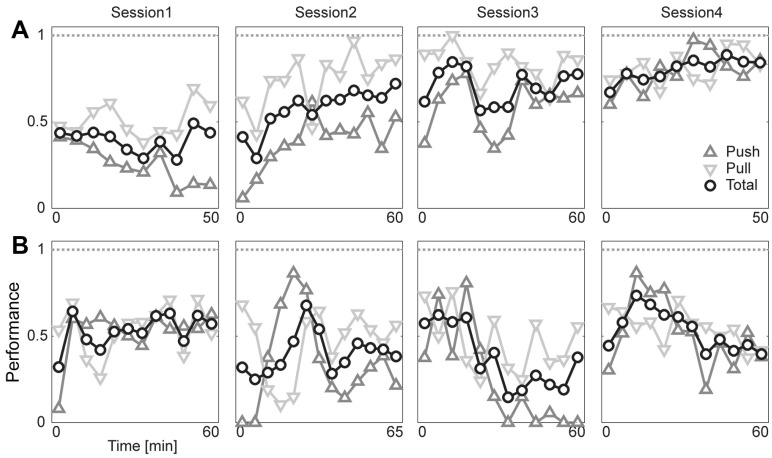
Fig. 5.
Performance of the cue discrimination tasks. (A) The rat, RS007, shows an improvement in the cue-discrimination tasks across session. Performances of both push (triangle) and pull (inverted triangle) were separately analyzed, and total (circle) indicates their averages. (B) RS008 shows no improvement.

