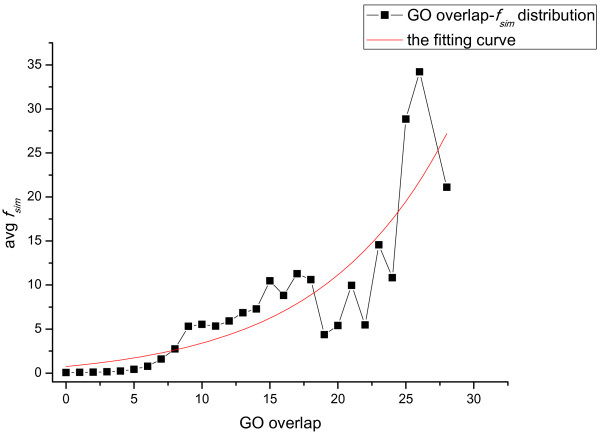
Figure 3.
The distribution of domain combination similarities with regard to different function similarities. The figure illustrates the statistical results of the average domain combination similarities with regard to different function similarity values. The function similarity value of two proteins is presented in terms of the overlaps of the GO terms between them. X-axis represents function similarities. Y-axis represents the corresponding the average domain combination similarities (avg fsim) between pairs of proteins in the network.

