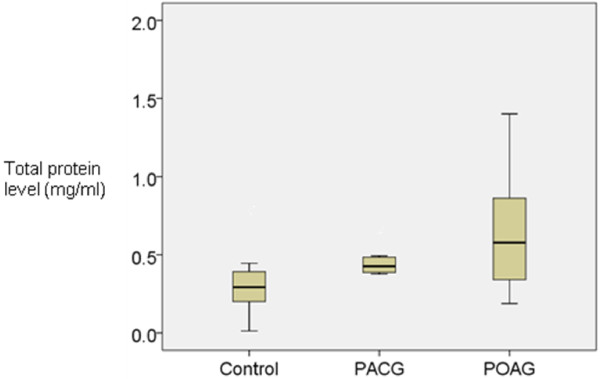
Figure 1.

Boxplot showing mean and distribution of total protein in the aqueous humour of control, PACG and POAG eyes. The means for the control, PACG and POAG groups were 0.292, 0.426 and 0.578 mg/ml respectively. The levels were significantly higher in the PACG and POAG eyes compared to controls (p = 0.043 and 0.007 respectively).
