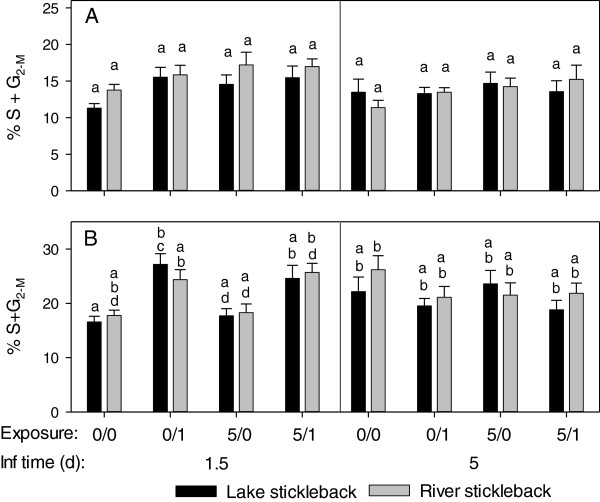
Figure 5.
Proliferation of lymphocytes (A) and monocytes (B) in D. pseudospathaceum exposed sticklebacks. Head kidney leukocytes were subjected to cell cycle analysis by means of flow cytometry 1.5 and 5 days after the last exposure. Proportions of cells in the S and G2-m phase of the cells cycle were determined in the lymphocyte and the monocyte gate (mean and SE, 0/0 = sham exposed controls, 0/1 = single exposure only, 5/0 = pre-exposures only, 5/1 = pre- and single exposures, different letters above bars indicate significant differences p < 0.05 with sequential Bonferroni correction for multiple testing). Note: different y-axis scaling in A and B.

