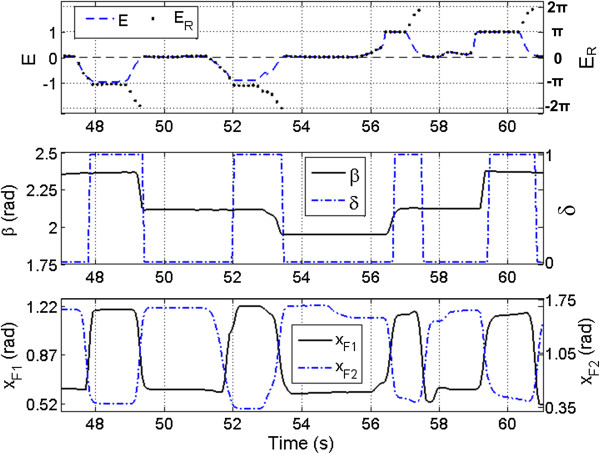
Figure 5.
Sinusoidal synergy controller: rhythmic method example data. Sample data from the synergy controller performing the unscrewing and screwing task with the Rhythmic EMG mapping method. The top graph illustrates the mapping of the amplified and filtered EMG signals (EE and EF, which comprise E, (1)) to the controller input ER. The middle graph depicts the change in cylinder position (β) as the Shadow Hand executes the contact strokes. The bottom graph shows the corresponding joint angles from the first finger required to rotate the cylinder.

