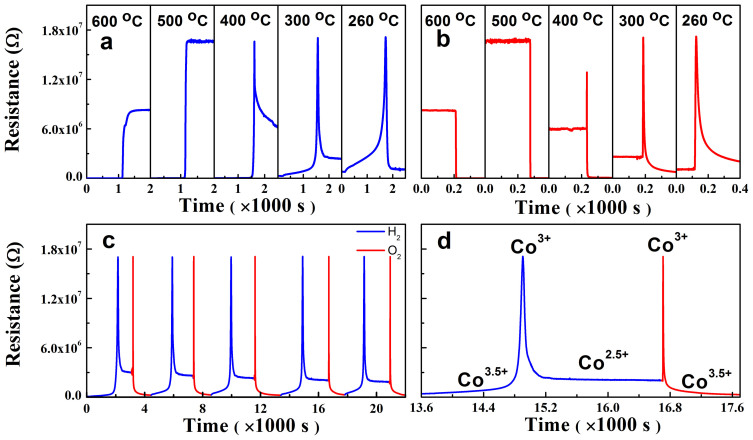
Figure 3. Resistance changes vs. the gas flow time, R vs. t, of an epitaxial ErBCO thin film.
(a) During the reduction (under H2) cycle at various temperatures. (b) During the oxidation (under O2) cycle at various temperatures. (c) At 350°C under the switching flow of the reducing (H2) and oxidizing (O2) gases. (d) Zoomed-in view of (c) for one set of reduction oxidation cycles.

