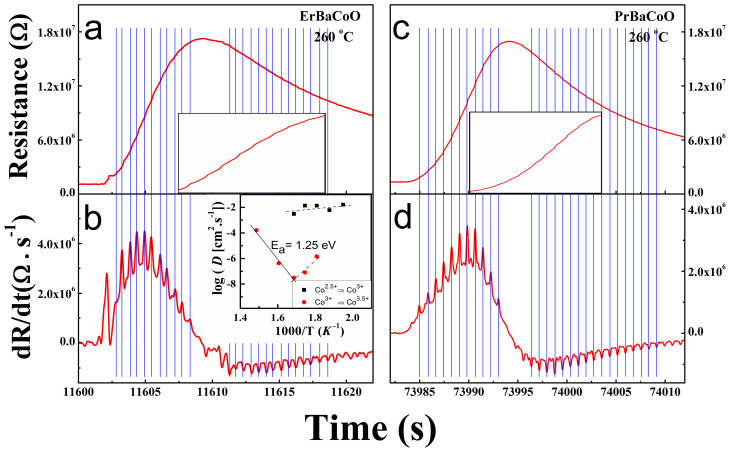
Figure 4.
(a, b) R vs. t and dR/dt vs. t plots for the epitaxial ErBCO films, and (c, d) those for the epitaxial PrBCO thin films, taken for an oxidation cycle at 260°C. The insets in (a) and (c) show the zoomed-in view of the R vs. t plot in the regions of t = 11603 – 11608 and 7392 – 7412, respectively. The inset of (b) shows the Arrhenius plot, log D vs. 1000/T, based on the data of Table 1, with the negative and positive slopes indicated by solid and dashed lines, respectively.

