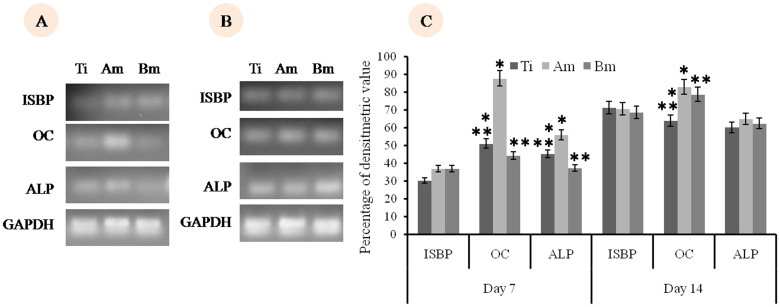
Figure 4. Osteoblast differentiation.
Semi-quantitative RT-PCR of osteoblast differentiation gene markers. End products of semi-quantitative reverse transcription (sqRT-PCR) reaction are analyzed with agarose gel. Densitometric quantification was done from the image of PCR product using ImageJ software and normalized values (with GAPDH as internal control) were plotted. Statistical analysis of mean densitometric values of RT-PCR product was done by Student's t-test. * and ** denotes statistically significant difference (p < 0.05) between Ti, Am and Ti and Bm respectively.

