Figure 5.

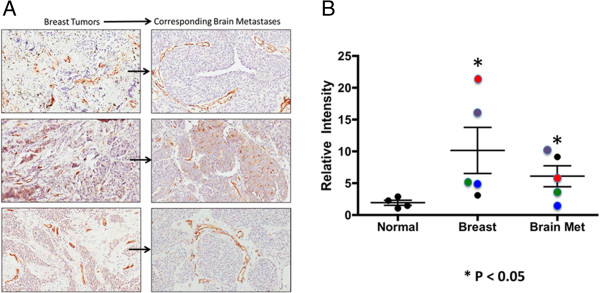
PSMA Staining in Breast Cancer and Brain Metastases. A – PSMA staining for breast tumors and breast tumor brain metastases pairs. Each pair of sections is from a different breast tumor case (n = 3). Size bars in all panels indicate approximately 50 μm. B – Graph of PSMA staining intensity for primary breast tumors and for breast tumor brain metastases, showing individual patient values and group mean (bars). The color coding indicates those primary breast tumor and brain metastases that came from the same patient (n = 4). Although there was considerable variability, each group included individual PSMA staining data points that were higher than the largest values for normal brain staining in terms of PSMA, these data were significant (p < 0.05), and for 3 of 4 patients staining intensity was less for breast cancer brain metastases than for the primary breast tumors.
