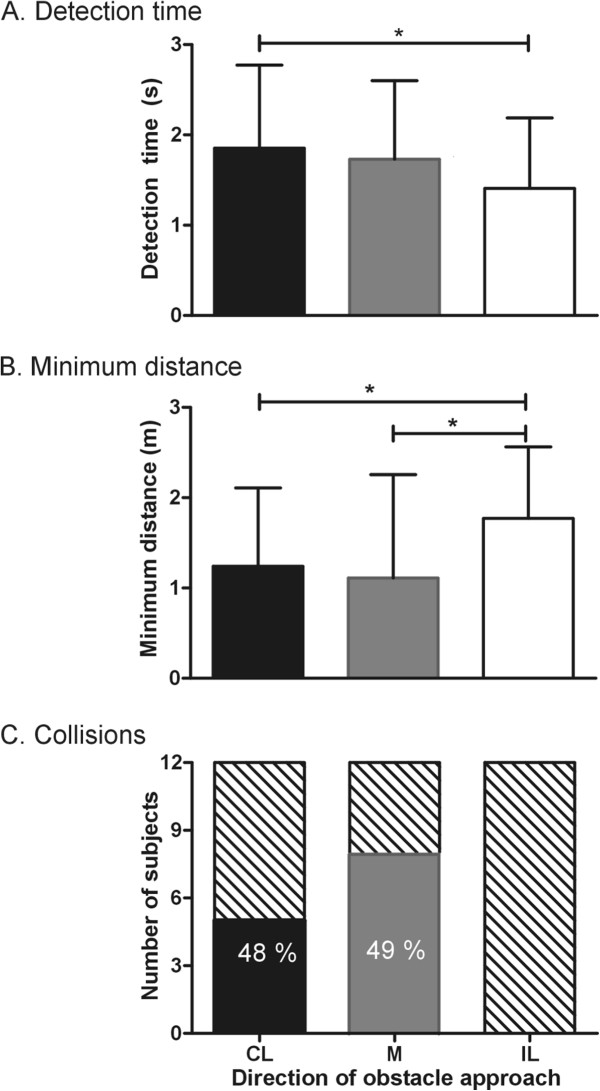
Figure 2.

Mean ± 1SD values of all participants for A) detection times [perceptuo-motor task] B) Minimum absolute distances maintained between the participants and the obstaclesas well as C) the distribution of colliders (solid) and non-colliders (lined) [locomotor task] for the contralesional (CL), middle (M) and ipsilesional (IL) obstacles. The digits in the solid columns indicate the average percentage of trials in which collisions were recorded for the specific obstacle direction. * p < 0.05.
