
Figure 12.
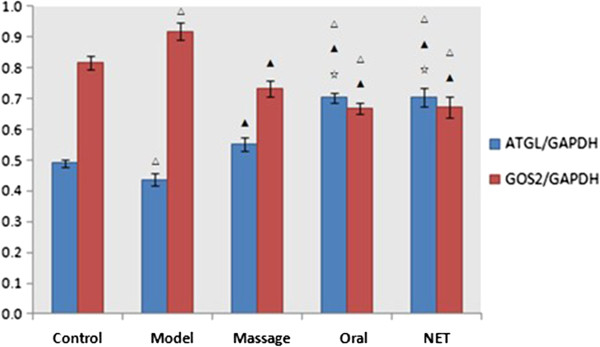
Comparison of ATGL and G0S2 protein expression in the adipose tissue. Notes: △P < 0.05 compared with the control group; ▲P < 0.05 compared with the model group; ☆P < 0.05, compared with the Massage group.
Official websites use .gov
A
.gov website belongs to an official
government organization in the United States.
Secure .gov websites use HTTPS
A lock (
) or https:// means you've safely
connected to the .gov website. Share sensitive
information only on official, secure websites.
Comparison of ATGL and G0S2 protein expression in the adipose tissue. Notes: △P < 0.05 compared with the control group; ▲P < 0.05 compared with the model group; ☆P < 0.05, compared with the Massage group.