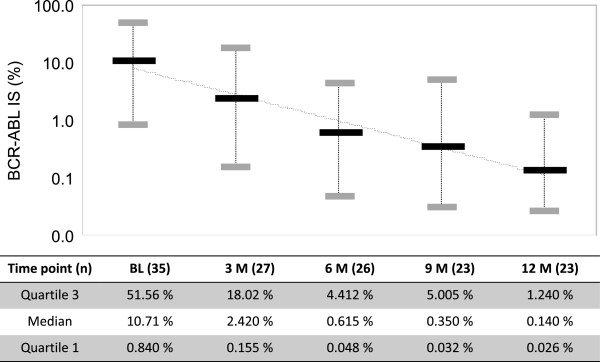
Figure 2.

Kinetics of BCR-ABL1 expression. The black bars indicate the median. The gray bars indicate quartiles 1 and 3. The X-axis shows the time-point and patient number for evaluation of molecular responses. The Y-axis shows BCR-ABL1 transcript levels per the international scale of standardized quantitative real-time polymerase chain reaction.
