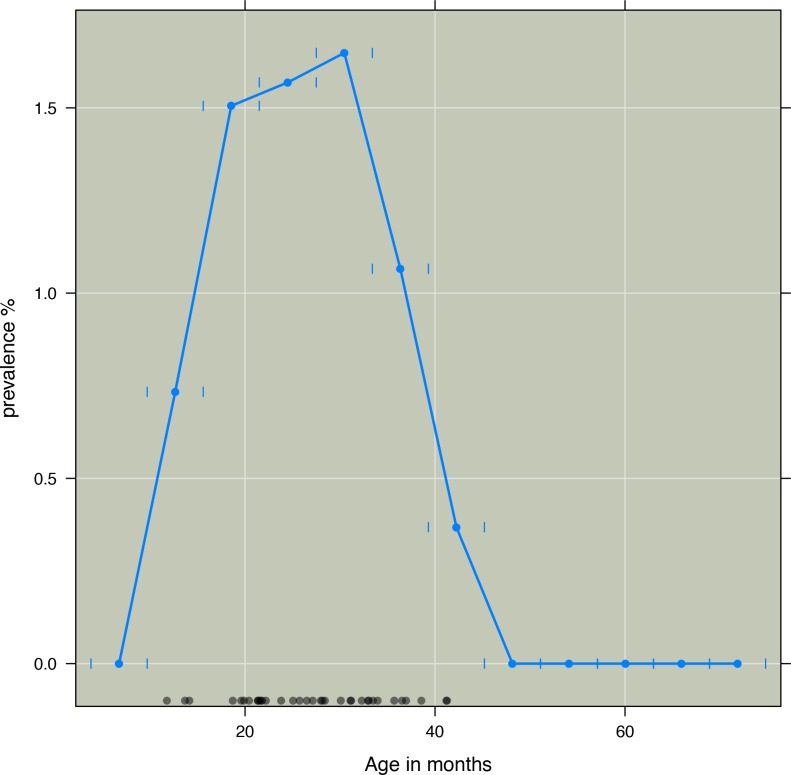
Figure 1. Three months prevalence of kwashiorkor according to age in months in intervals of six months.
Prevalence of kwashiorkor (y-axis) against age in months (x-axis). Prevalence aggregated by age group. Short vertical blue lines indicate age groups. Black dots indicate age of those children who developed kwashiorkor. Age at first time a child was observed with kwashiorkor was used.

