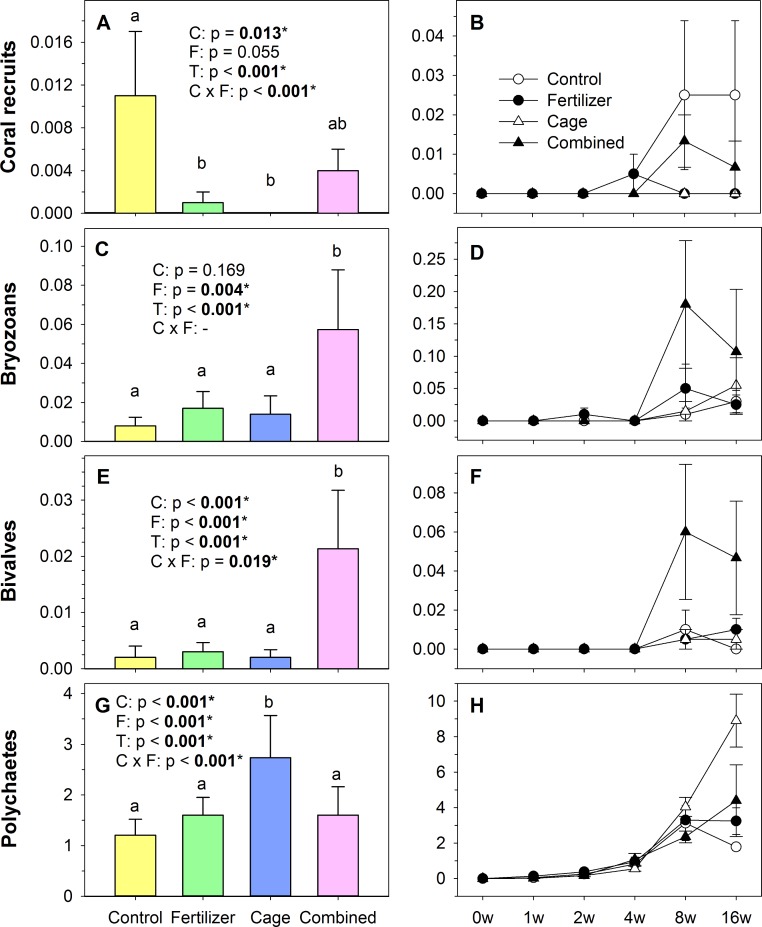
Figure 2. Invertebrate settlement numbers (depicted per cm−2; mean ± SE) on shaded tiles.
Left column (A, C, E, G) shows settlement numbers per treatment averaged over all tiles and right column (B, D, F, H) shows temporal development of counted recruits of all 4 treatments. p-values were calculated from a 3-factorial GLM and originate from analysis across the whole study period (see Table S1 for full results). Dashes represent factors that have been excluded by the model reduction. Abbreviations: C, Cage; F, Fertilizer; T, Time. Treatments with same small letters are not significantly different (p > 0.05) in post hoc pairwise comparisons.

