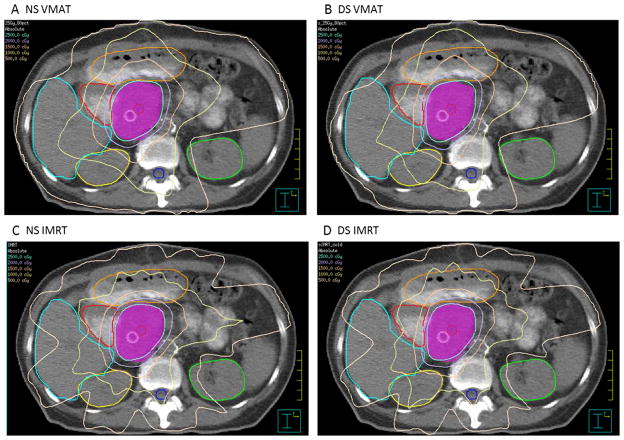
Fig. 3.
Representative axial slices showing contoured ROIs and isodose distributions for (A) NS VMAT, (B) DS VMAT, (C) NS IMRT, and (D) DS IMRT plans. As delineated by the legend in the top left corner of each image, isodose lines are shown every 500 cGy from 500–2500 cGy. Contoured ROIs shown include the liver, duodenum, jejunum (not dosimetrically evaluated in this study), PTV, right kidney, spinal cord, and left kidney. (Color version of figure is available online.)

