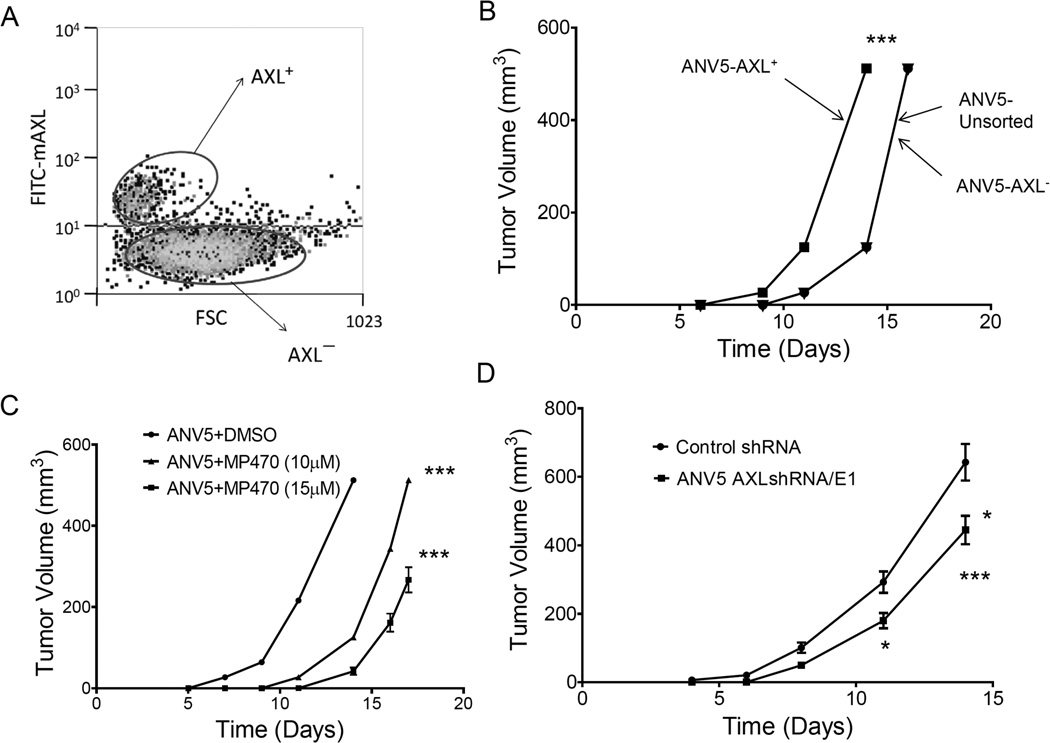
Figure 5.
AXL expression correlates with increased tumorigenicity in BCSCs. A, AXL staining dot plots used to sort ANV into AXL positive and AXL negative populations. B, Mean (± SEM, n=5) tumor volumes over time in mice injected with either AXL+, AXL− or unsorted ANV5s. Curves for AXL5- and unsorted ANV5s are superimposed because the two cell populations formed tumors to the same extent. C, Mean (± SEM, n=5) tumor volumes over time in mice that received MP470- or control-treated ANV5s. D, Mean (± SEM, n=5) tumor volumes over time mice injected with AXL knockdown or control ANV5 cells. The experiments were repeated at least two times independently with similar results. Statistical significance was determined by two-way ANOVA. *p<0.05; ***p<0.001. While all lines have error bars, some errors are small and obscured by the symbols.

