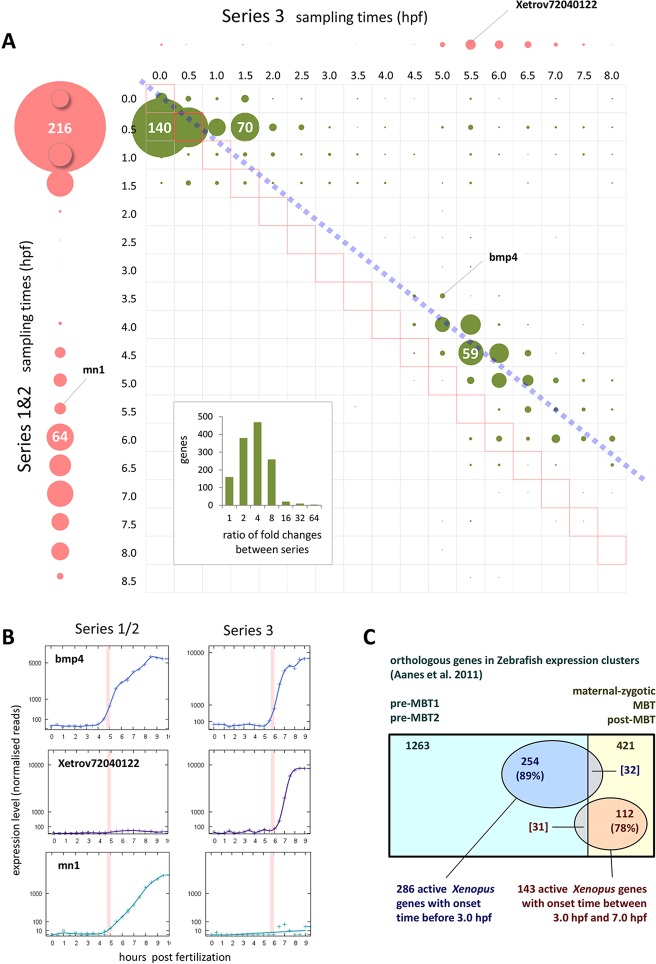
Fig. 4.
Reproducibility and conservation in time series data. (A) Reproducibility of onset times between Series 1&2 and Series 3. Genes with an onset time and at least a tenfold change in one or both series plotted in circles of size proportional to the numbers of genes (figures shown in white for scale). Single gene circles are not plotted. Green circles represent genes with onset fold change of at least 2× in the other time series, allowing for significant difference in fold change (see text). Genes in circles adjacent to dashed blue line (developmental time equivalence between Series 1&2 and Series 3; see Materials and methods) are considered to have reproducible onsets. Pink circles represent genes having detectable onset in only Series 1&2 (vertical axis) or Series 3 (horizontal axis). Inset: numbers of genes with onsets in both series at different ratios of fold change. (B) Examples of genes (marked in A) showing: reproducible onset times (Bmp4); no detectable onset in Series 1&2 (Xetrov72040122); and no detectable onset in Series 3 (Mn1). (C) Conservation shown in overlap between Xenopus and zebrafish genes associated with either polyadenylation or transcription. Numbers show frog-fish orthologues; genes in zebrafish expression profile clusters (Aanes et al., 2011) shown in rectangles, and X. tropicalis genes with onset times indicating polyadenylation or transcription (fold change threshold ≥5) shown in ovals.

