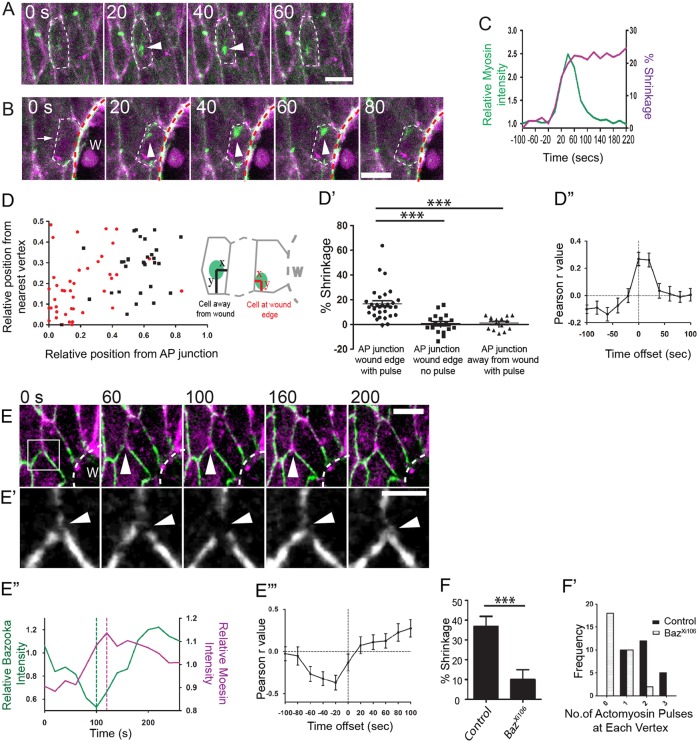
Fig. 3.
Junctional shrinking pulses correlate with myosin flashes near the junction. (A,B) Time-lapse still images showing myosin (green, arrowheads) coalescing at the apex of a cell in the unwounded epithelium (A) and at the vertex of a wound edge cell (arrowheads) of an AP junction (arrow) (B). Dashed lines indicate cell outlines. (C) Plot of relative myosin intensity (green) versus percentage shrinking of the AP junction (magenta) over time. (D) Plot of the location of myosin pulses (indicated by green in schematics) in cells at wound edge (red) versus at least three rows away from the wound (black) (n≥25 pulses from 21 cells from eight different wounds for each cell type). (D′) Plot of percentage AP junction shrinkage after each pulse of myosin (n≥18 pulses from 15 cells in ten wounds for each). (D′′) Pearson correlation for the change in myosin intensity around the shrinking AP junctions versus change in junction length. r values were calculated by shifting the myosin data set in time (n=22 junctions from ten wounds). (E) Time-lapse (still) images from a wound edge cell as Bazooka-GFP (green) is lost from the cell vertex (arrowheads) of the AP junction, immediately prior to an actin pulse (magenta). (E′) High magnification view of the region highlighted in E of the Bazooka-GFP channel only, showing a break and re-sealing of Bazooka (arrowheads). (E′′) Plot of the relative Bazooka-GFP intensity (green) and relative Moesin intensity at the break point in E. Dashed lines indicate where loss of Bazooka precedes an actin pulse. (E′′′) Pearson correlation of Bazooka-GFP intensity versus mCherry-Moesin intensity at cell vertices. r values were generated by shifting the Moesin data set in time (n=24 vertices from six wounds). (F) Percentage junction shrinkage over 30 min of wound closure in control versus BazXi106 mutant embryos (n≥22 junctions from five wounds for each). (F′) Frequency distribution of actin pulses in control versus BazXi106 mutant embryos (n≥27 vertices from six wounds for each). Wounds (W) all marked by dashed white lines. Scale bars: 5 µm (A,B,E); 2 µm (E′). Error bars represent s.e.m. ***P<0.001, one-way ANOVA with Bonferroni's post-hoc test (D′) or Student's t-test (F). Time is in seconds.

