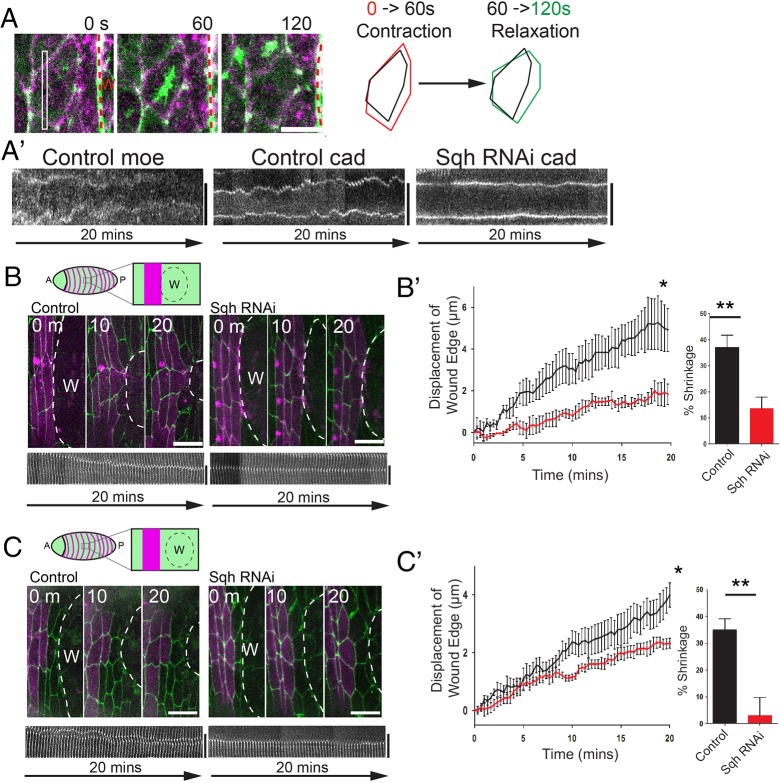
Fig. 4.
Inhibiting myosin pulses prevents junction shrinkage and wound edge advancement. (A) Time-lapse (still) images from a movie showing a myosin (green) pulse as it drives contraction and then relaxation (see schematic) of a wound edge cell. (A′) Kymograph analysis of cell areas showing apical area fluctuations in control cells from A (Control moe, Control cad), but no fluctuations when these cells express Spaghetti-squash RNAi (Sqh RNAi cad). (B,C) Wounds made immediately adjacent to control or Sqh RNAi-expressing engrailed cells (B) or with one row of wild-type cells between the wound and engrailed stripes (either control or expressing Sqh RNAi; C) (see schematics) in E-cadherin-GFP embryos with engrailed stripes labelled with mCherry-Moesin (magenta). Kymograph analysis shows junction dynamics in control and Sqh RNAi-expressing cells for junctions between the first and second row cells. (B′,C′) Plots of epithelial advancement over time in wounds made immediately adjacent to (B′) or with one row of wild-type cells in front of (C′) control and Sqh RNAi-expressing cells (n=3 wounds for each in B′ and n=7 in C′). Bar graphs show percentage shrinking of junctions between front and second row cells after 20 min of wound closure (n≥7 junctions from three wounds in B′ and n ≥7 junctions from seven wounds in C′). Error bars represent s.e.m. Time is in seconds (A) or minutes (B,C). Scale bars: 5 µm (A); 10 µm (B,C). *P<0.05, two-way ANOVA with Bonferroni's post-hoc test; **P<0.01, Student's t-test.

