
Figure 1.
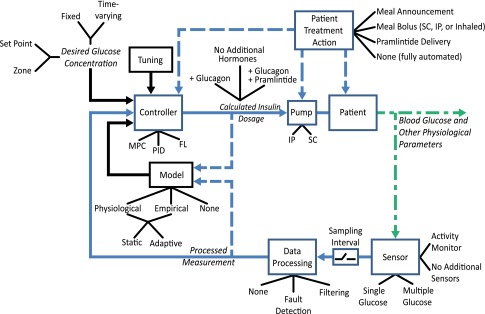
Taxonomy of the AP design. A specific AP configuration is created by selecting options for each of the major elements shown in the figure. Solid lines demonstrate connections that are always present and dashed lines represent connections that may only be present in some configurations. The tuning, model, and desired glucose concentration are all part of the controller, as signified by the black arrows. Green color distinguishes physiological states or properties from measured or digital signals. Black lines are used to indicate predetermined features of a block, and blue lines indicate signals or actions conducted during closed-loop operation.