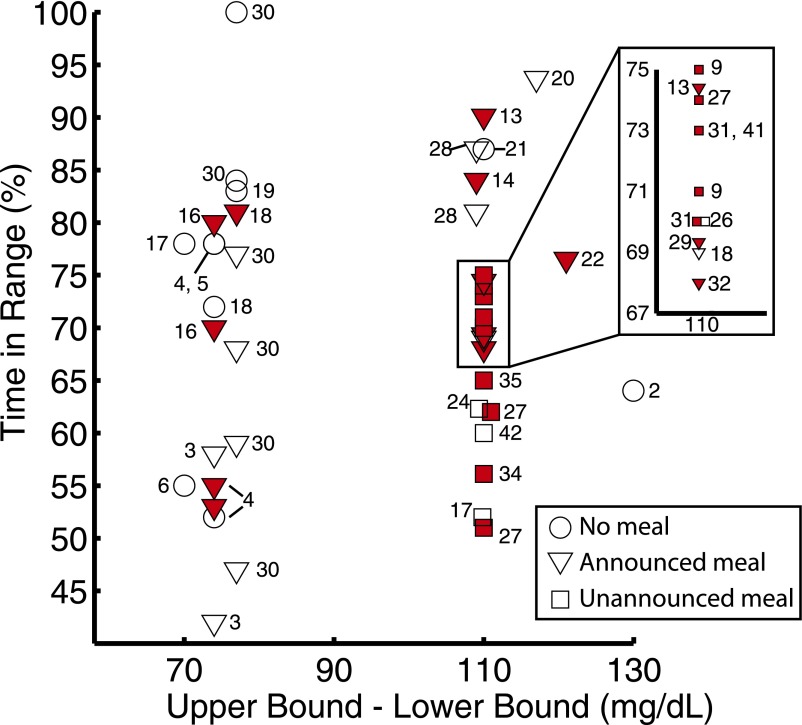
Figure 2.
Summary of the percentage of time in desired range reported by studies published in the years 2010–2013. The results are plotted against the size of the desired range (upper bound − lower bound), with all studies but one using between 63 and 71 mg/dL as the lower bound (59 mg/dL in ref. 22). A circle, triangle, or square indicates that there were no meals, announced meals, or meals with no announcement/prebolus, respectively, during the time period used to calculate the percent time in range. A red shaded icon indicates that the time period used to calculate percent time in range was longer than 12 h. Multiple icons are used for a single study if there were different protocol branches or if results were reported only for discrete segments of the study (e.g., overnight and postprandial results reported separately).

