Figure 3.

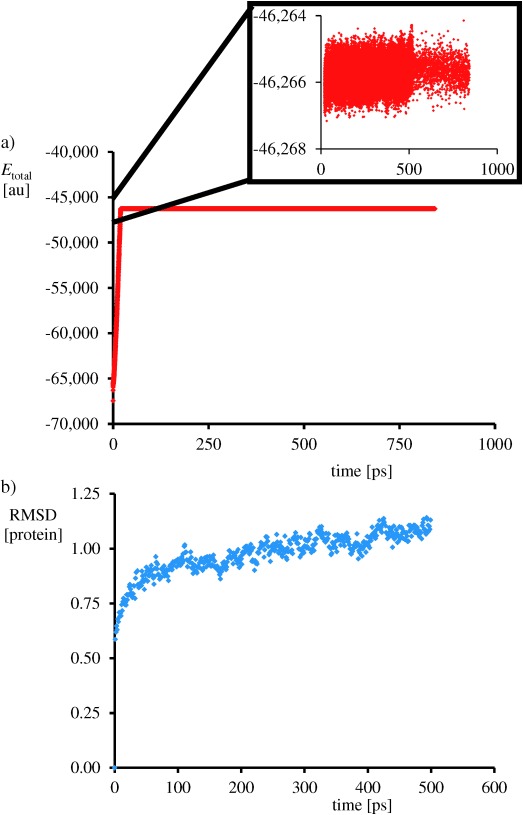
Molecular dynamics scan at 298 K of the protein. a) Plot of the total MM energy as a function of time. b) RMSD value of the protein structure as a function of time.

Molecular dynamics scan at 298 K of the protein. a) Plot of the total MM energy as a function of time. b) RMSD value of the protein structure as a function of time.