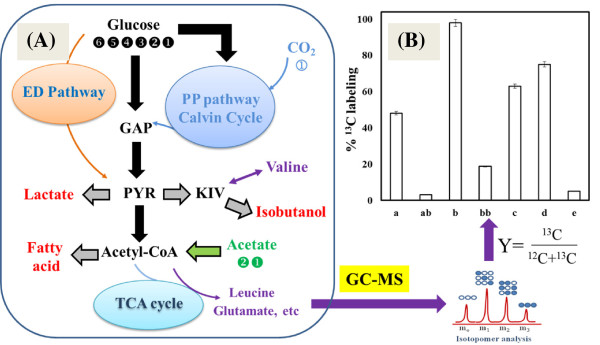
Figure 2.

Schematic examples to demonstrate the use of 13C-analysis in elucidating the contributions of various carbon substrates towards the final product synthesis. (A) Biosynthesis yield analyzed by feeding cells with 13C-substrates (such as fully labeled glucose and acetate). Abbreviations: GAP, Glyceraldehyde-3-phosphate; PYR, pyruvate; KIV, ketoisovalerate. (B) Relative product yields from a primary substrate (a – Isobutanol from glucose in a low performance strain; ab – valine from glucose in a low performance strain; b – Isobutanol from glucose in JCL260; bb – valine from glucose in JCL260) [28]; c – Free fatty acids from acetate in an E. coli strain [30]; d - biomass from glucose in wild type Synechocystis 6803 [32]; e - D-lactate from acetate in engineered Synechocystis 6803 [33]).
