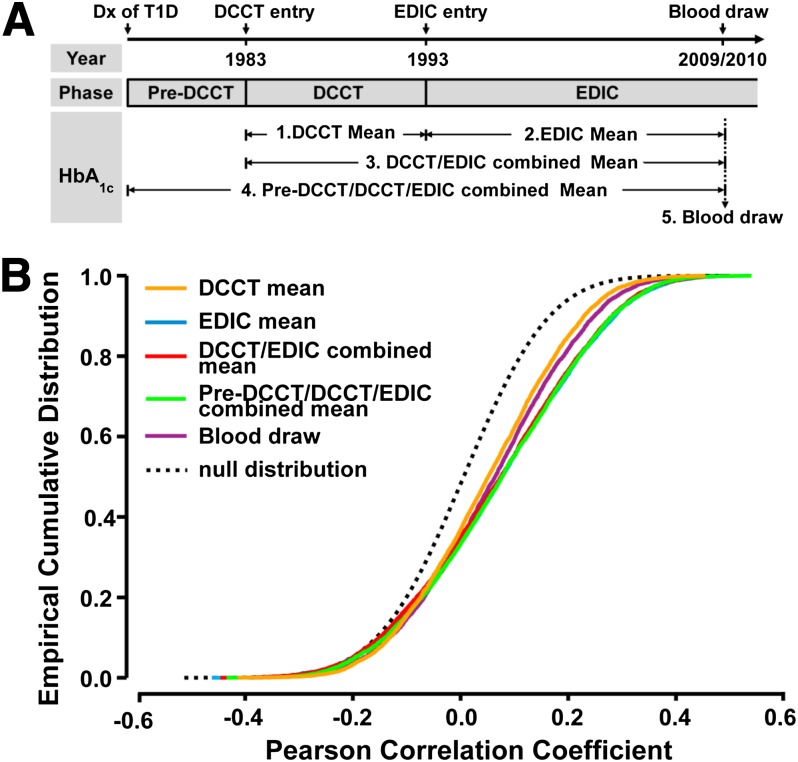
Figure 2.
Association of monocyte H3K9 acetylation levels with HbA1c at different time periods. A: The five time periods from which documented HbA1c values for the case and control groups were used. Each EDIC participant’s history of type 1 diabetes (T1D) is divided into three phases: Pre-DCCT, DCCT, and EDIC. The pre-DCCT phase is from the date of type 1 diabetes diagnosis (Dx) to the date of entry into the DCCT in 1983. DCCT is from entry into DCCT to the end of DCCT in 1993 within which HbA1c was measured quarterly. EDIC is from 1993 (start of EDIC) to current, during which HbA1c level was documented annually. All our study participants had blood drawn in the EDIC year 16/17 (2009–2010), and the HbA1c level measured at this time is termed the “blood draw.” HbA1c levels in the other four periods (DCCT, EDIC, DCCT/EDIC, and Pre-DCCT/DCCT/EDIC) are represented by mean values across specified periods. B: Association of acetylation levels with HbA1c level at H3K9 commonly acetylated regions. Commonly acetylated regions across all 60 samples were defined as regions enriched with H3K9Ac in at least 15 samples (25%) that were at least 350 bp in length. The average acetylation level at each of the resulting 6,248 commonly acetylated regions was calculated in each sample, and its relationship with HbA1c level at different time periods (color coded) is represented by Pearson correlation coefficient. Sample permutation (n = 100) was performed to generate the correlation coefficients under the null condition. The cumulative densities of the correlation coefficients are plotted (color solid lines, original data; black dashed line, permuted data), and a shift to the right indicates a higher positive association. The statistical significances of distances between two empirical distributions were tested using Kolmogorov-Smirnov tests. The time periods are color-coded as indicated.

