
Figure 1.
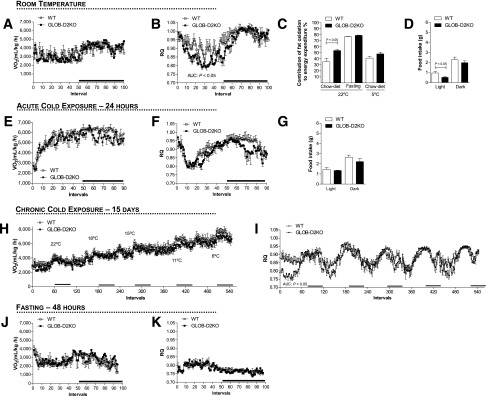
Metabolic phenotype of the GLOB-D2KO mouse. GLOB-D2KO and WT controls were acclimated to individual metabolic cages in the CLAMS for 48 h before measurements were recorded. (A) Oxygen consumption (VO2) during 12-h light and dark cycles recorded at the second day after acclimatization. (B) Same as in A, except that what is shown is RQ. (C) Contribution of fat oxidation to daily EE during the light cycle. (D) Food intake during light and dark cycles of animals kept on regular chow diet at room temperature (22°C). (E) VO2 during 12-h light and dark cycles recorded during acute cold (4°C) exposure. (F) Same as in E, except that what is shown is RQ. (G) Food intake during light and dark cycles of animals kept on regular chow diet during the period of cold (4°C) exposure. (H) VO2 register during chronically (15 days) cold exposed, where the environment temperature was gradually and progressively decreased every 3–4 days. (I) Same as in H, except that what is shown is RQ. (J) VO2 during 12-h light and dark cycles recorded on the first day of 48 h of fasting. (K) Same as in J, except that what is shown is RQ. Entries are mean ± SEM of 3–7 animals. Area under the curve was calculated during light and dark cycles for each individual animal. Statistical significance is shown in each graph and was set as P < 0.05. Student t test was used to compare WT and GLOB-D2KO groups within treatment conditions. Black horizontal bars denote the dark period of the day (12 h). AUC, area under the curve.