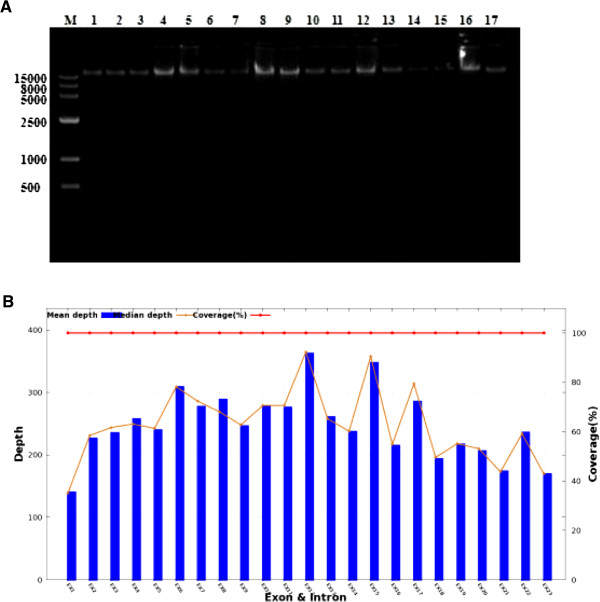
Figure 3.

Genomic DNA extraction and TECTA exon-capture sequencing report. A. Agarose gel examination of genomic DNA quality. 1:I2; 2:II3; 3:III15; 4: III7;5: IV6; 6: II2;7: II7;8: II5;9: II8;10: III3; 11: III10;12: III21;13: III26;14: III28;15: IV4;16: IV14; 17:IV18. B. TECTA exon-capture sequencing report. Mean depth(X): the sequencing depth of each exon. Median depth(X): This number of depth is the median depth when depth of all sites was in an ascending sort. Coverage (%): Divide the total length of the target regions by bases generated by sequencing.
