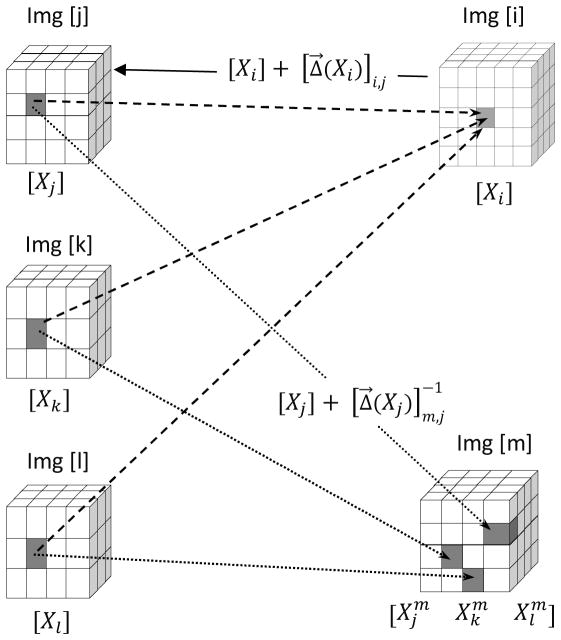
Figure 1.
Schematic diagram to illustrate the DDM concept. Voxels at locations Xj, Xk, Xl in the images [j], [k], and [l] that are co-registered at the same voxel Xi in image [i] (dashed lines) are typically registered at different locations in another image [m] (dotted lines). The mean distances between these voxels correspond to DDM.

