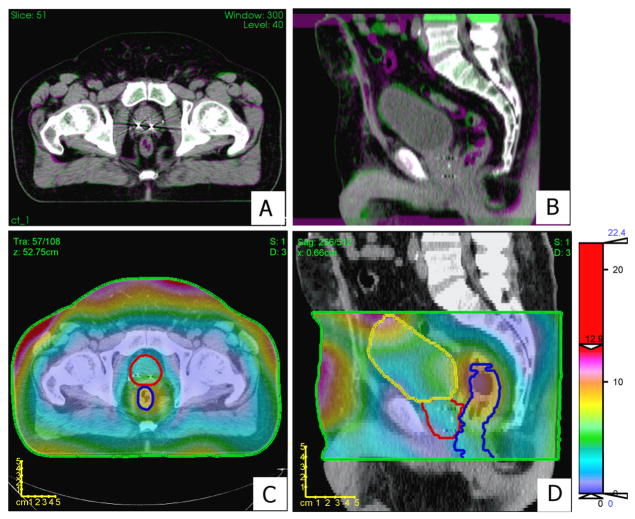
Figure 5.
Panels A and B show an axial and sagittal view, respectively, of the intra-patient DIR of scan-9 on the reference image (scan-1). Green or red-violet indicates inconsistency in the registration between the images. Panels C and D show a color wash representation of DDM (mm) superimposed over an axial slice and a sagittal slice, respectively, on scan-1. The color bar is scaled to emphasize DDM values in the prostate region. Contours are shown for the rectum (blue), prostate (red), bladder (yellow), and DDM-VOI (green).

