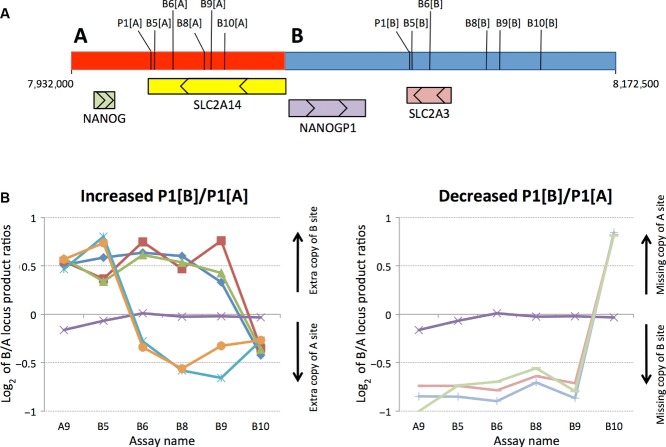
Figure 4.
Locating ancestral NAHR events. A: The location of sequences amplified by PRT P1 and pPRTs B5, B6, B8, B9, and B10 are indicated on the tandem repeat (unit A in red, unit B in blue), along with the four genes in the region with arrows showing the direction of transcription. B: The chart-labeled “Increased P1[B]/P1[A]” displays five samples whose previous P1 assay data suggested the presence of an extra copy of the P1[B] sequence on one chromosome, plus a normal sample (purple). Ancestral NAHR events can be taken to have occurred in intervals flanked by assays with markedly different relative abundances of unit B and unit A sequences (see Fig. 3). The blue and orange samples are two Yoruban DNAs, both of which reveal ancestral NAHR events between the sites of assays B5 and B6. The red, dark blue, and green samples are European in origin and reveal NAHR events between markers B9 and B10. The chart labeled “Decreased P1[B]/P1[A]” displays three samples whose previous P1 assay data suggested they were missing the P1[B] site from one chromosome, plus a normal sample (purple). All three non-normal samples are European in origin and reveal additional ancestral NAHR between markers B9 and B10.

