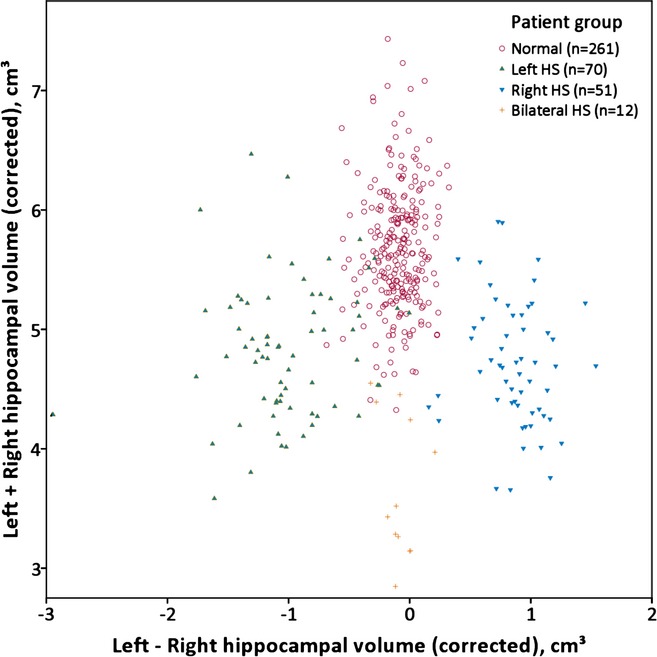
Figure 4.

Corrected volumes and asymmetry for subjects in the template database. Scatterplot of sum of left and right hippocampal volumes versus difference between these volumes (corrected for intracranial volume) divided into groups by the prior clinical classification.
