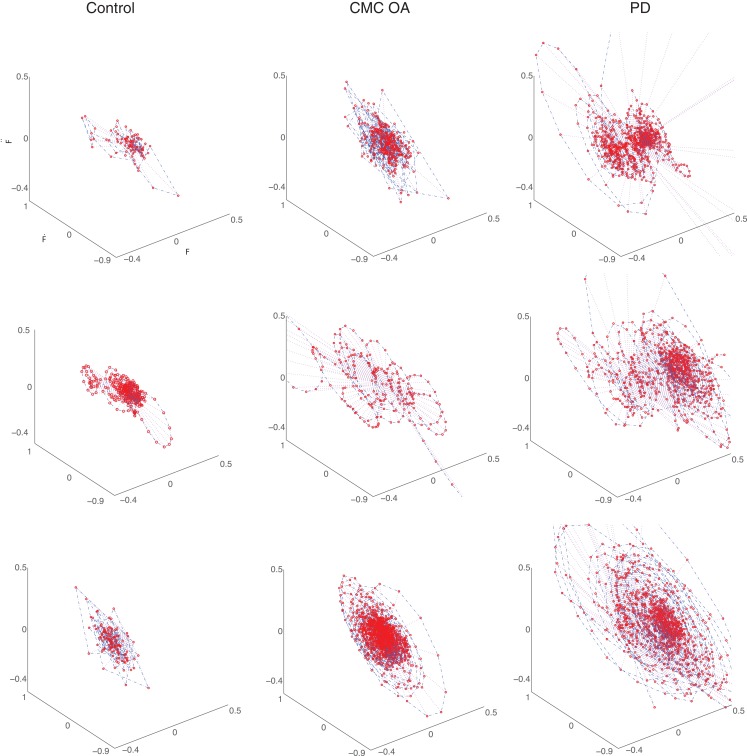
Figure 5.
Representative phase portraits of three participants from each group (ages between 70 and 75 years): healthy control subjects (first column), participants diagnosed with CMC OA (second column), and participants diagnosed with PD (third column). The clinical subjects exhibit greater dispersion in the phase portrait than the control subjects.

