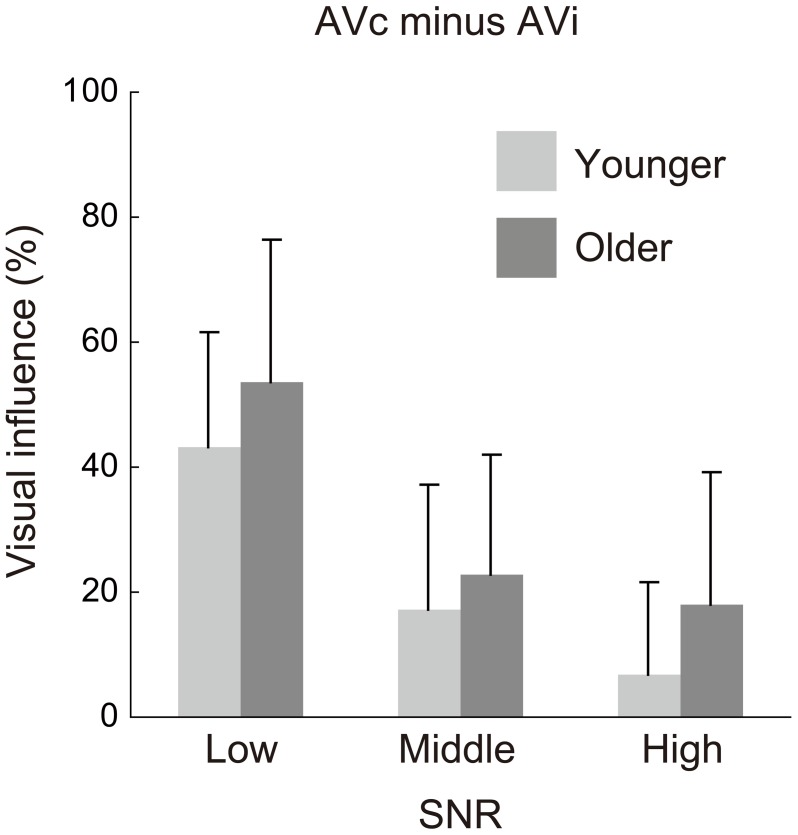
Figure 4.
Visual influence scores for the low, middle, and high signal-to-noise ratio (SNR) conditions in the younger and older groups. The scores were calculated by subtraction of percent correct for the auditory-visual incongruent (AVi) condition from the percent correct for the AV-congruent (AVc) condition.

