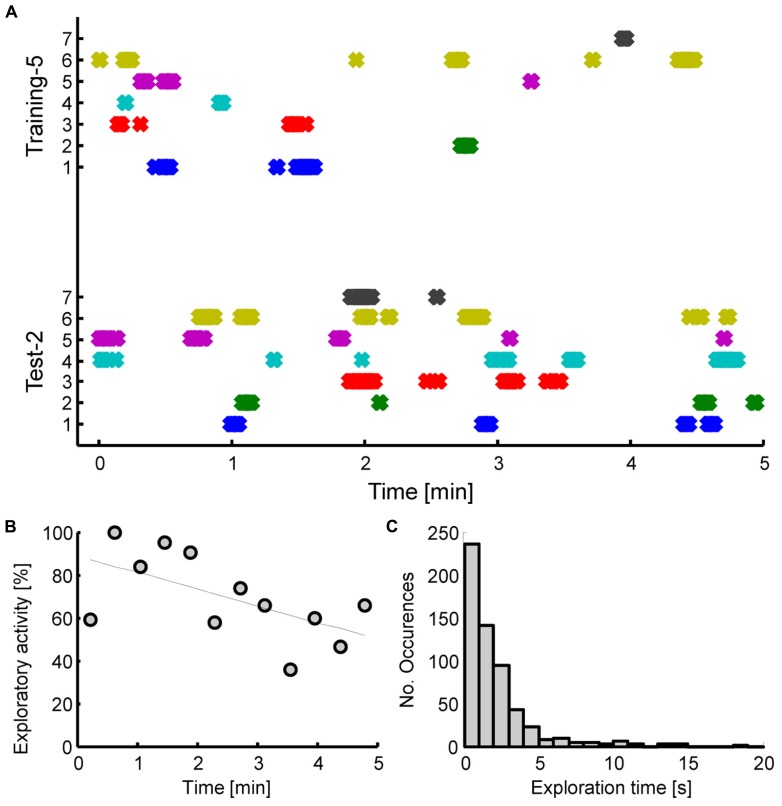
FIGURE 4.
(A) Exploration times of individual tree shrews for the displaced object during the second test session (bottom panel), and as a control the corresponding times for the same object prior to displacement during the last training session (top panel). Animals 1-5 were experienced and had already participated in previous similar experiments whereas animals six, seven were task naïve. A cross symbol is plotted for each 100 ms interval that the animal spent exploring. Continuous shaded regions thus represent multiple overlapping symbols and correspond to continued exploration. (B) Time course of overall exploration time for all objects during the first 5 min of exploration for all training and test sessions considered together. (C) Distribution of duration of exploration for individual contacts with the target objects (O1, O2, or O3).

