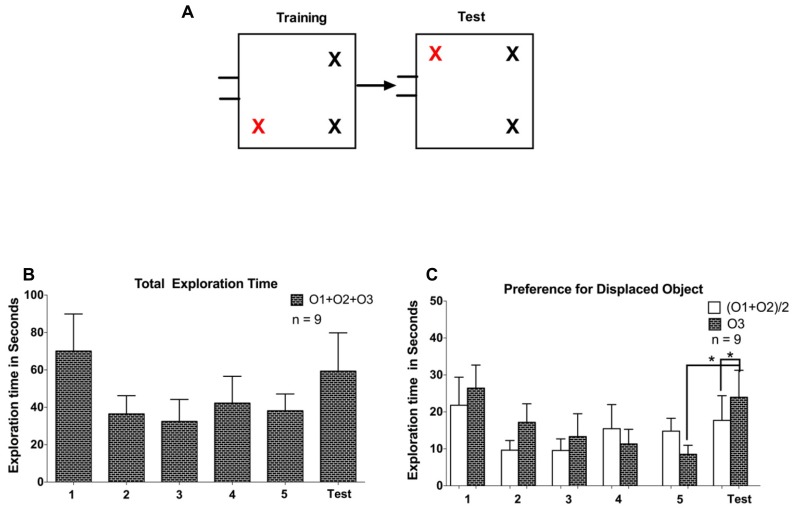
FIGURE 5.
(A) Representation of experiment phases in Experiment 3. (B) Total exploration time spent exploring all objects (O1 + O2 + O3). O3 represents the displaced object. (C) Comparison of exploratory activity for the displaced object O3 to the average of the non-displaced objects (O1 + O2)/2. Error bars denote the SEM (*P < 0.05).

