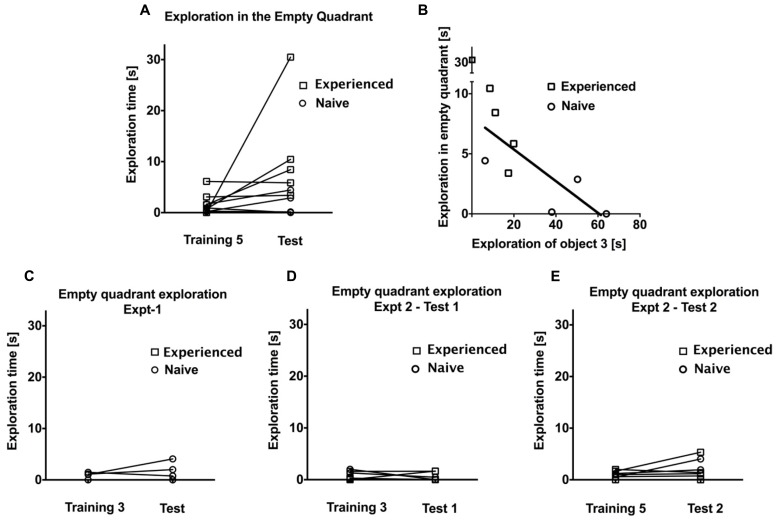
FIGURE 6.
(A) Comparison of exploratory activity of the empty quadrant during the test session and the corresponding area on the prior training session in Experiment 3 for experienced and naive animals. Round symbol shows the naive animals and square symbol shows the experienced ones. (B) Linear regression demonstrating that animals, which spent considerable time exploring the empty quadrant, tended to devote little exploration to the displaced object on the test day in Experiment 3. C–E shows the comparison of exploratory activity of the empty quadrant during the test session and the corresponding area on the prior training session in Experiment 1, Experiment 2 for test 1 and prior training session, and test 2 and prior training session, respectively, for experienced and naive animals.

