Figure 2. Plots of panoromic information.
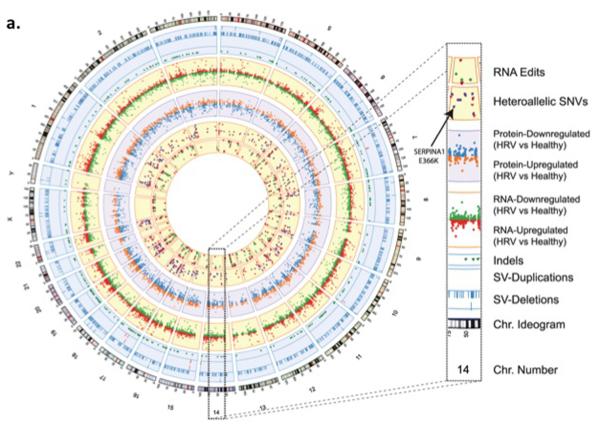
a) Circos plot from the Snyderome
Circos plot summarizing the Snyder genome. From outer to inner rings: chromosome ideogram; genomic data (pale blue ring), structural variants >50 bp (deletions [blue tiles], duplications [red tiles]), indels (green triangles); transcriptomic data (yellow ring), expression ratio of viral infection to healthy states; proteomic data (light purple ring), ratio of protein levels during human rhinovirus (HRV) infection to healthy states; transcriptomic data (yellow ring), differential heteroallelic expression ratio of alternative allele to reference allele for missense and synonymous variants (purple dots) and candidate RNA missense and synonymous edits (red triangles, purple dots, orange triangles and green dots, respectively). From From (Chen et al., 2012) with permission.
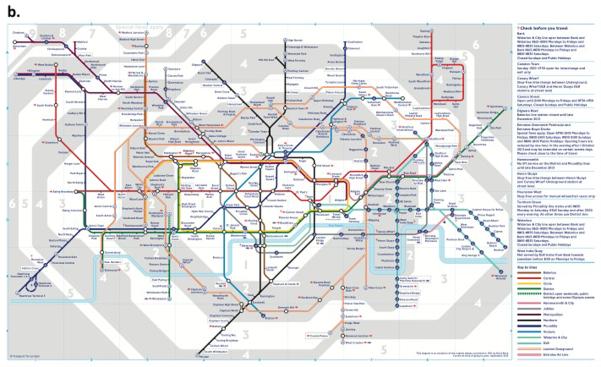
(b) Adopted London Tube Model of Integrated Omics from Shendure and Aiken
Integration of the many applications of next-generation DNA sequencing which include: sites of DNA methylation (Methyl-Seq), Protein-DNA interactions (CHIP-Seq), 3-dimensional genome structure (Hi-C), genetically targeted purification of polysomal mRNAs (TRAP), the B-cell and T-cell repertoires (Immuno-Seq), and functional consequences of genetic variation (Synthetic saturation mutagenesis) with a small set of core techniques, represented as open circles of “stations.” Like subway lines, individual sequencing experiments move from station to station, until they ultimately arrive at a common terminal: DNA sequencing.
From (Shendure and Lieberman Aiden, 2012) with permission.


