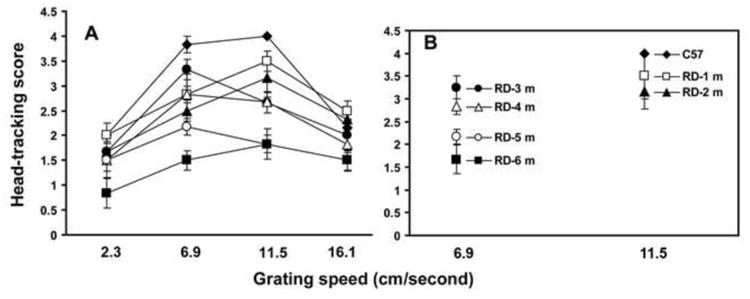
Figure 3.

Progressive changes in the OHT response in rd10 mice evaluated by testing under varying grating speeds (mean±SE). Based on the level of head-tracking, the responses were scored on a scale of 0-4 (‘0’ = no response; ‘4’ = best response). RD mice were tested for head-tracking response once a month from 30 days to 6 months of age. (A) At younger ages (30-35 days), the optokinetic score was close to the normal control level; as the disease progressed, considerable loss of head-tracking score was observed. The grating speed that evoked the maximum head-tracking score changed during the progression of the disease.(B) Scatter plot demonstrating that in rd10 mice at early stages of degeneration (1 and 2 months of age), the maximum head-tracking score was observed at a grating speed that evoked the maximum response in normal control animals. As the disease further progressed (3, 4, and 5 months of age), maximum head-tracking score was apparent at a slower grating speed. The interaction between age and grating speed in determining the maximum head-tracking score is found to be statistically significant (Two Factor ANOVA, P<0.05).
