
Figure 3.
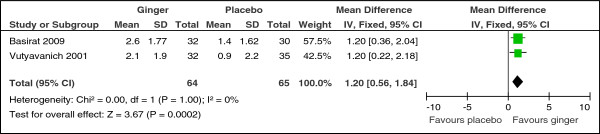
Forest plot of the improvement in nausea symptoms measured by change in VAS scores (ginger versus placebo).
Official websites use .gov
A
.gov website belongs to an official
government organization in the United States.
Secure .gov websites use HTTPS
A lock (
) or https:// means you've safely
connected to the .gov website. Share sensitive
information only on official, secure websites.
Forest plot of the improvement in nausea symptoms measured by change in VAS scores (ginger versus placebo).