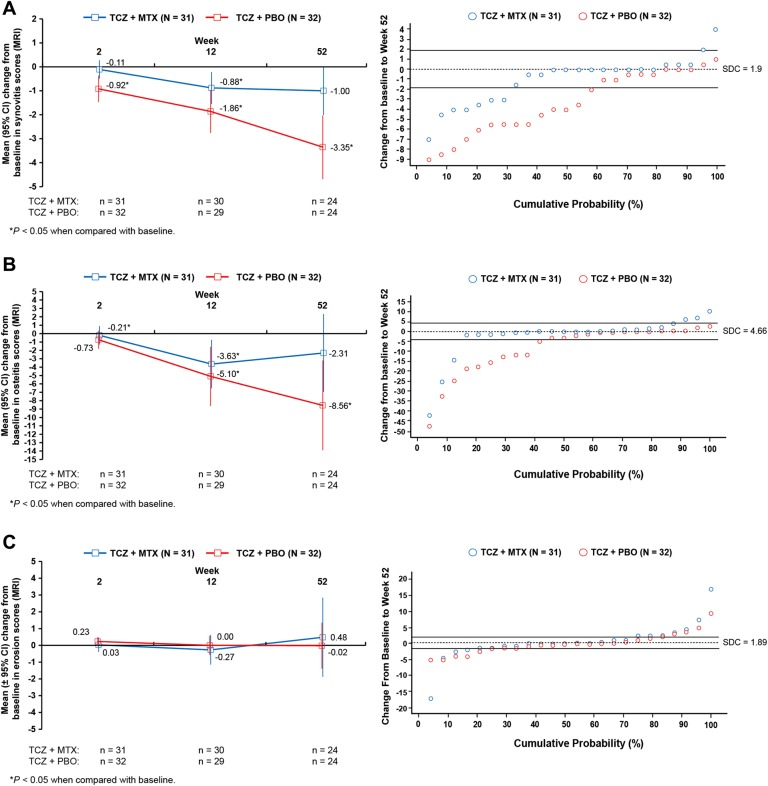
Figure 2 .
Changes in MRI scores in patients taking tocilizumab (TCZ) 8 mg/kg plus methotrexate (MTX) or placebo (PBO) plus MTX. (A) Mean change from baseline in synovitis scores over 52 weeks and cumulative distribution plot of the mean change from baseline in synovitis scores at week 52. (B) Mean change from baseline in osteitis scores over 52 weeks and cumulative distribution plot of the mean change from baseline in osteitis scores at week 52. (C) Mean change from baseline in erosion scores over 52 weeks and cumulative distribution plot of the mean change from baseline in erosion scores at week 52. Synovitis scores could range from 0 to 24. Osteitis scores could range from 0 to 75. Erosions scores could range from 0 to 250. p Value is from the within-group Wilcoxon signed-rank test of the hypothesis of no change from baseline. SDC, smallest detectable change.

